Summary of biological indicators
LIFE ELIA
- (Short version of this report)
- Digest of the monitoring of biological indicators (Action A2)
- Introduction
- Invertebrate data (standardized inventories + point data)
- Results of standardized inventories
![]()
Digest of the monitoring of biological indicators (Action A2)
Results on 27-09-2017
Introduction
The choice of indicators
The inventories are carried out by points located a priori on map and then relocated during the first field visit, according to the accessibility and homogeneity of the habitat. The LIFE monitoring strategy is to target a broad spectrum of organisms associated with open intraforestry and edge habitats (vascular plants, birds, bats, butterflies), and ponds (Odonata and Amphibians).
Actions concerned by the monitoring of biological indicators
Among the 7 actions of the LIFE project, two of them (orchards and invasive plants) can not be the subject of a multi-group monitoring of the evolution of biodiversity. The quickness of response of biological indicators to the actions carried out varies considerably: the reaction to the digging of a new pool is almost immediate, whereas the development of the planted edges will take 10 to 15 years before expecting an effect on the organisms associated with it.
Consequently, the process of measuring the biological diversity of an initial state and subsequently adjusting and measuring its effects is rather relevant only to the created ponds or to certain developments made at the beginning of LIFE (flowery meadows, vegetation to restore moors). Typically, the monitoring of the planted edges will not make it possible to evaluate the beneficial effect of this action over the duration of the project.
On the other hand, the overall analysis of the inventories will make it possible to constitute a unique overview of the situation for the high tension transmission network on a broad spectrum of biological groups in the wooded areas of the Walloon Region.
Two ways of collecting biological data under high voltage lines are summarized in this document:
1. Standardized inventories: fixed points performed according to a precise method, repeatable elsewhere and throughout time.
2. Collection of all opportunistic data: allows to complete the overview of local fauna (and flora) and supplements the standardized inventories.
The motivation for selecting the inventorized groups is illustrated in the following table and diagram.
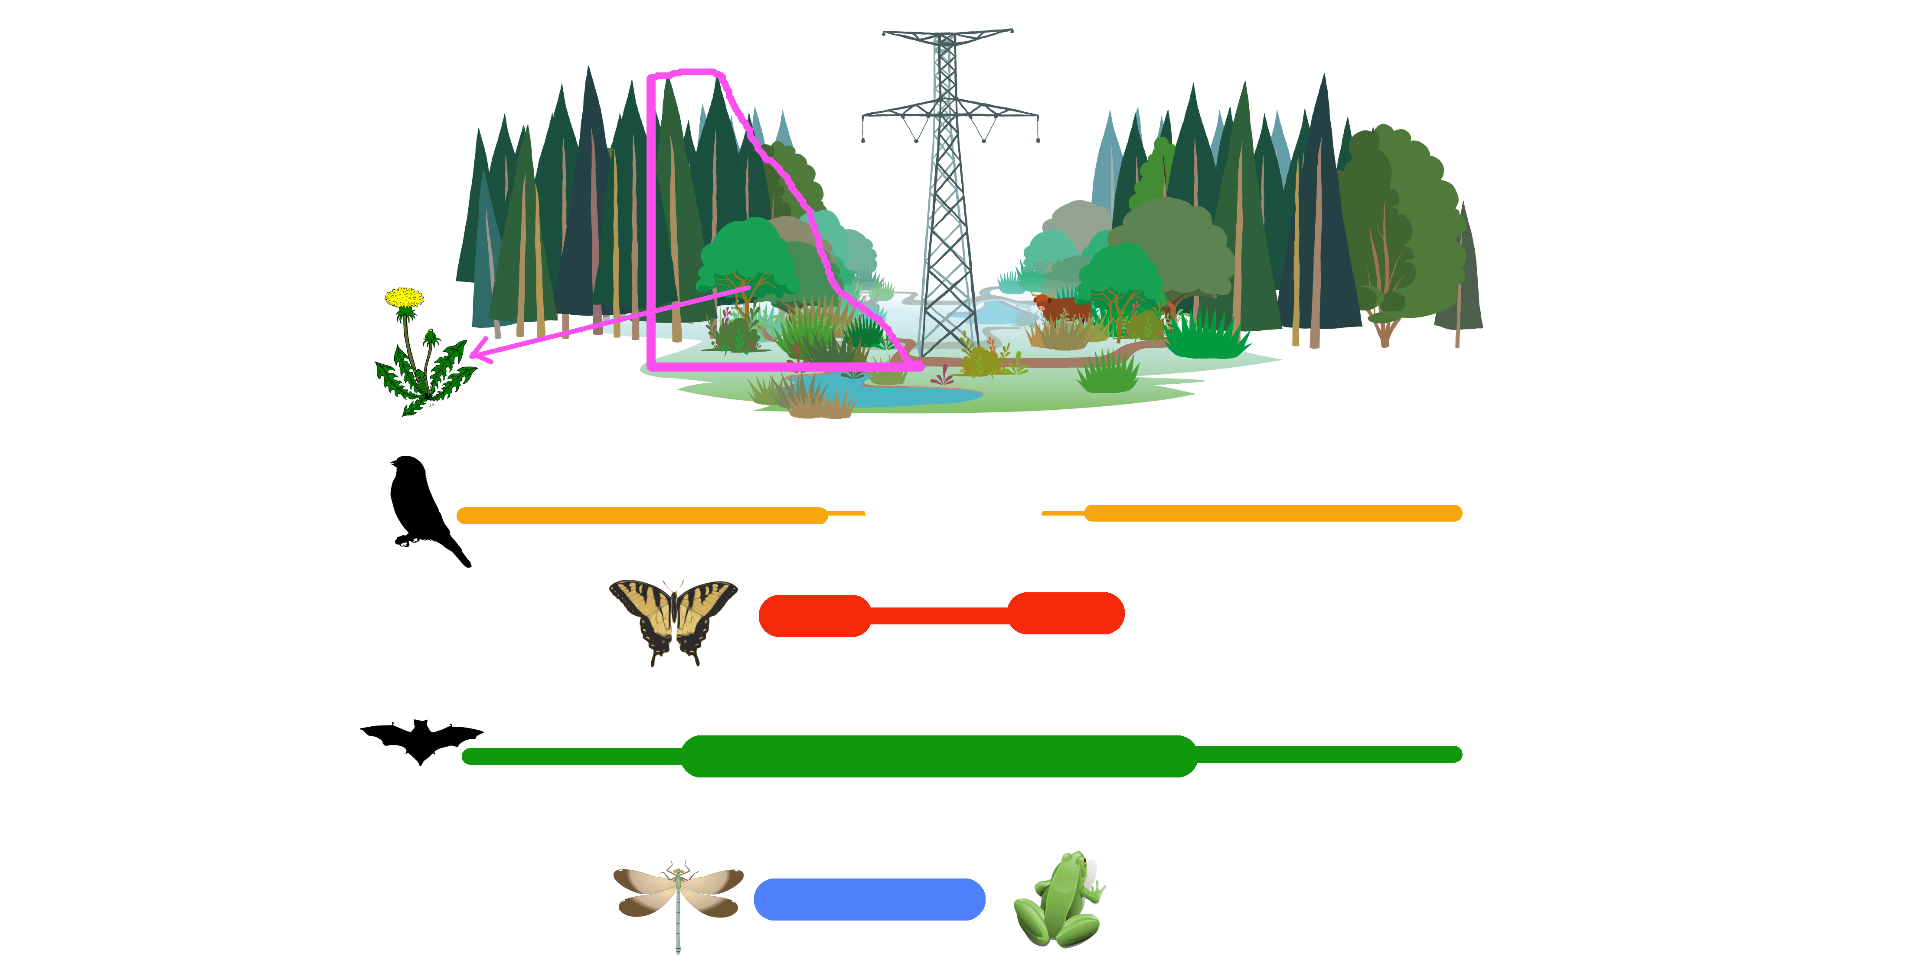
Schematic representation of the relevance of the groups studied in the different compartments of the studied habitats: forests, edges, grasslands and ponds. The thickness of the lines indicates the relevance of the study of these groups according to the habitat in which they are located in the corridor.
Table 1: taxonomic groups studied in the project. A cross indicates the relevance of these groups to the different actions.
| Group | C1 | C2 | C3 | C4 | C5 | C6 | C7 |
|---|---|---|---|---|---|---|---|
Birds |
x |
||||||
Butterflies |
x |
x |
x |
x |
|||
Dragonflies |
x |
x |
|||||
Amphibians |
x |
||||||
Reptiles |
x |
x |
x |
||||
Bats |
x |
x |
x |
x |
x |
||
Plants |
x |
x |
x |
x |
x |
Invertebrate data (standardized inventories + point data)
The red crosses localize the data encoded in the Walloon Region database for fauna and flora.
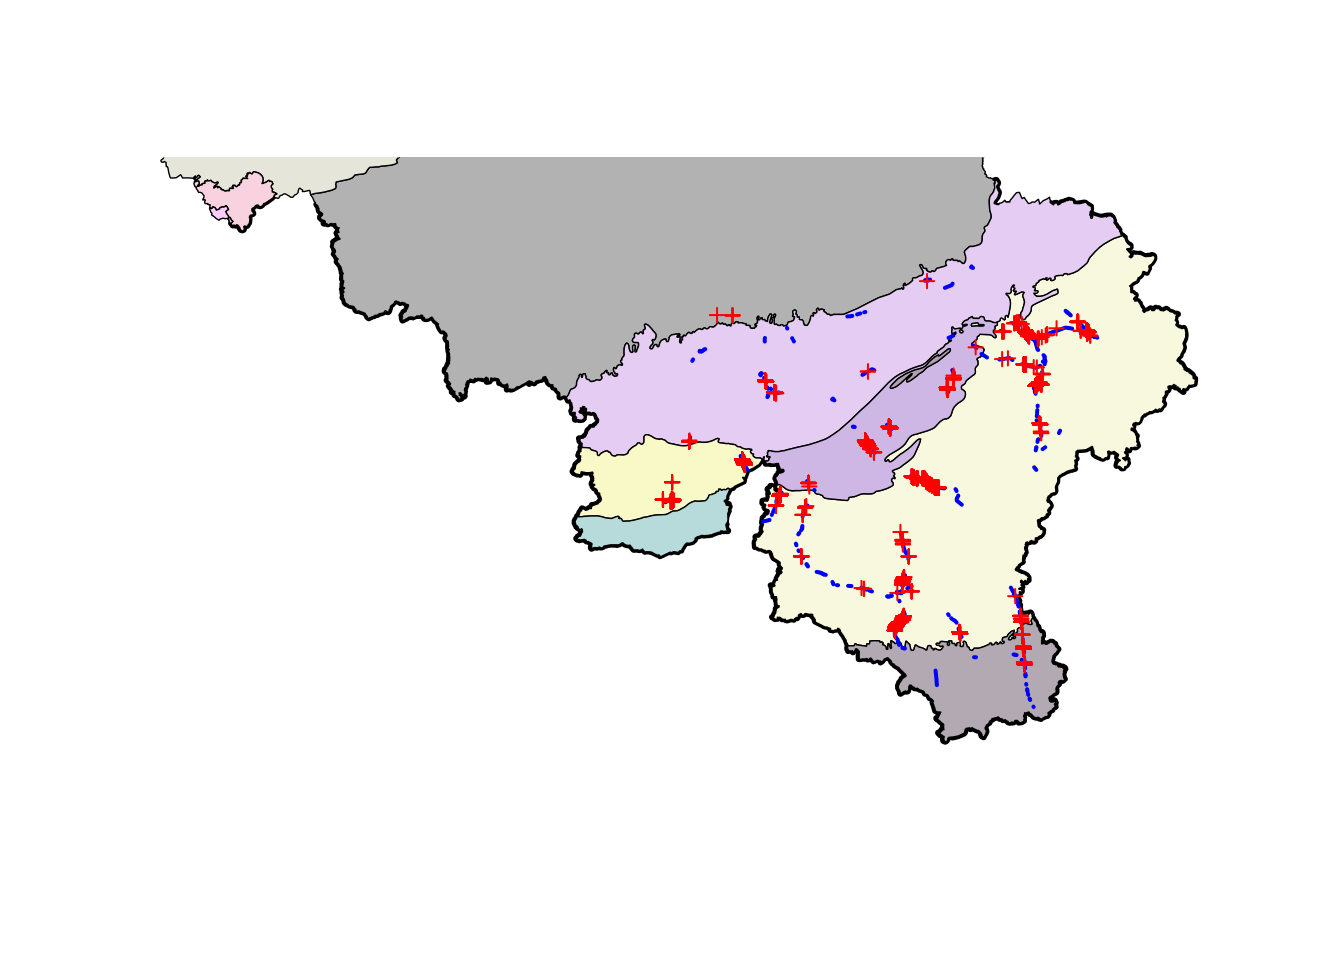
Localization of biological data (invertebrates)
| Natural region | Nb_données |
|---|---|
| Ardenne | 1031 |
| Condroz et sillon Sambro-Mosan | 139 |
| Fagne-Famenne-Calestienne | 843 |
| Lorraine | 82 |
| Région limoneuse | 5 |
| Inventorized taxa | Number of individuals |
|---|---|
| Papillons | 3921 |
| Libellules | 1079 |
| Orthoptères | 428 |
| Coccinelles | 141 |
| Hétéroptères | 111 |
| Autres Coléoptères | 79 |
| Diptères | 27 |
| Hétérocères | 16 |
| Hyménoptères | 4 |
The data of bats are currently processed and will be detailed in a forthcoming version of this document.
Results of standardized inventories
Birds
Introduction
The bird inventorization protocol set up under the LIFE Elia project is largely inspired by the birdwatch protocol established by the monitoring program for common birds (SOCWAL). This program has been active in Wallonia since 1990. The system is based on the detection of territorial manifestations, it makes it possible to highlight trends in the populations of bird species known as “widespread” or with “fairly numerous” numbers.
Morning breeding bird inventory
Principle
The principle of the method consists in recording, for a fixed period of time and during specified periods, all the birds observed and/or heard from fixed stations, the latter being called “listening points” and organized by clusters (so-called “chains”).
Methodology for inventory points
An inventory point corresponds to a “station” where all the birds seen and/or heard are recorded for a defined period of time and invariable in time and space, which lasts exactly 5 minutes in our case (a bird that flew away at our arrival can not be taken into account because the monitoring has not yet started). In order to avoid double counting, a distance of 250 m is respected between two points.
Each point is the subject of two annual visits: one between 20 March and 30 April and the other between 1 May and 20 June: the breeding species are therefore covered by these inventories. The two visits to each site must nevertheless be separated by at least one month. Inventories should ideally start shortly after sunrise and end no later than 4 hours after sunrise. All birds seen or heard (even at great distances) should be noted.
The inventories were carried out according to this methodology in 2012. It was then decided that the monitoring of the sites would be spread over two years in order to lighten the fieldwork. Thus, all the sites will have been inventoried in 2012, in 2013-2014 and finally in 2015-2016.
Localization of birds inventory points
A total of 39 inventory points were selected. They are distributed over the LIFE zones as shown on the following map.
Click on the map or points to display the information
Sampling effort
| Site | Number of species | Number of inventorization points |
|---|---|---|
| Frasnes | 33 | 3 |
| Rochefort | 38 | 5 |
| Orgeo | 34 | 5 |
| Lacuisine | 42 | 8 |
| Martelange | 32 | 4 |
| La Reid | 36 | 10 |
| Heinsch | 34 | 4 |
Results
Average number of individuals per inventorization point for each area
Click on the column headings to sort the values, click on a line to mark it
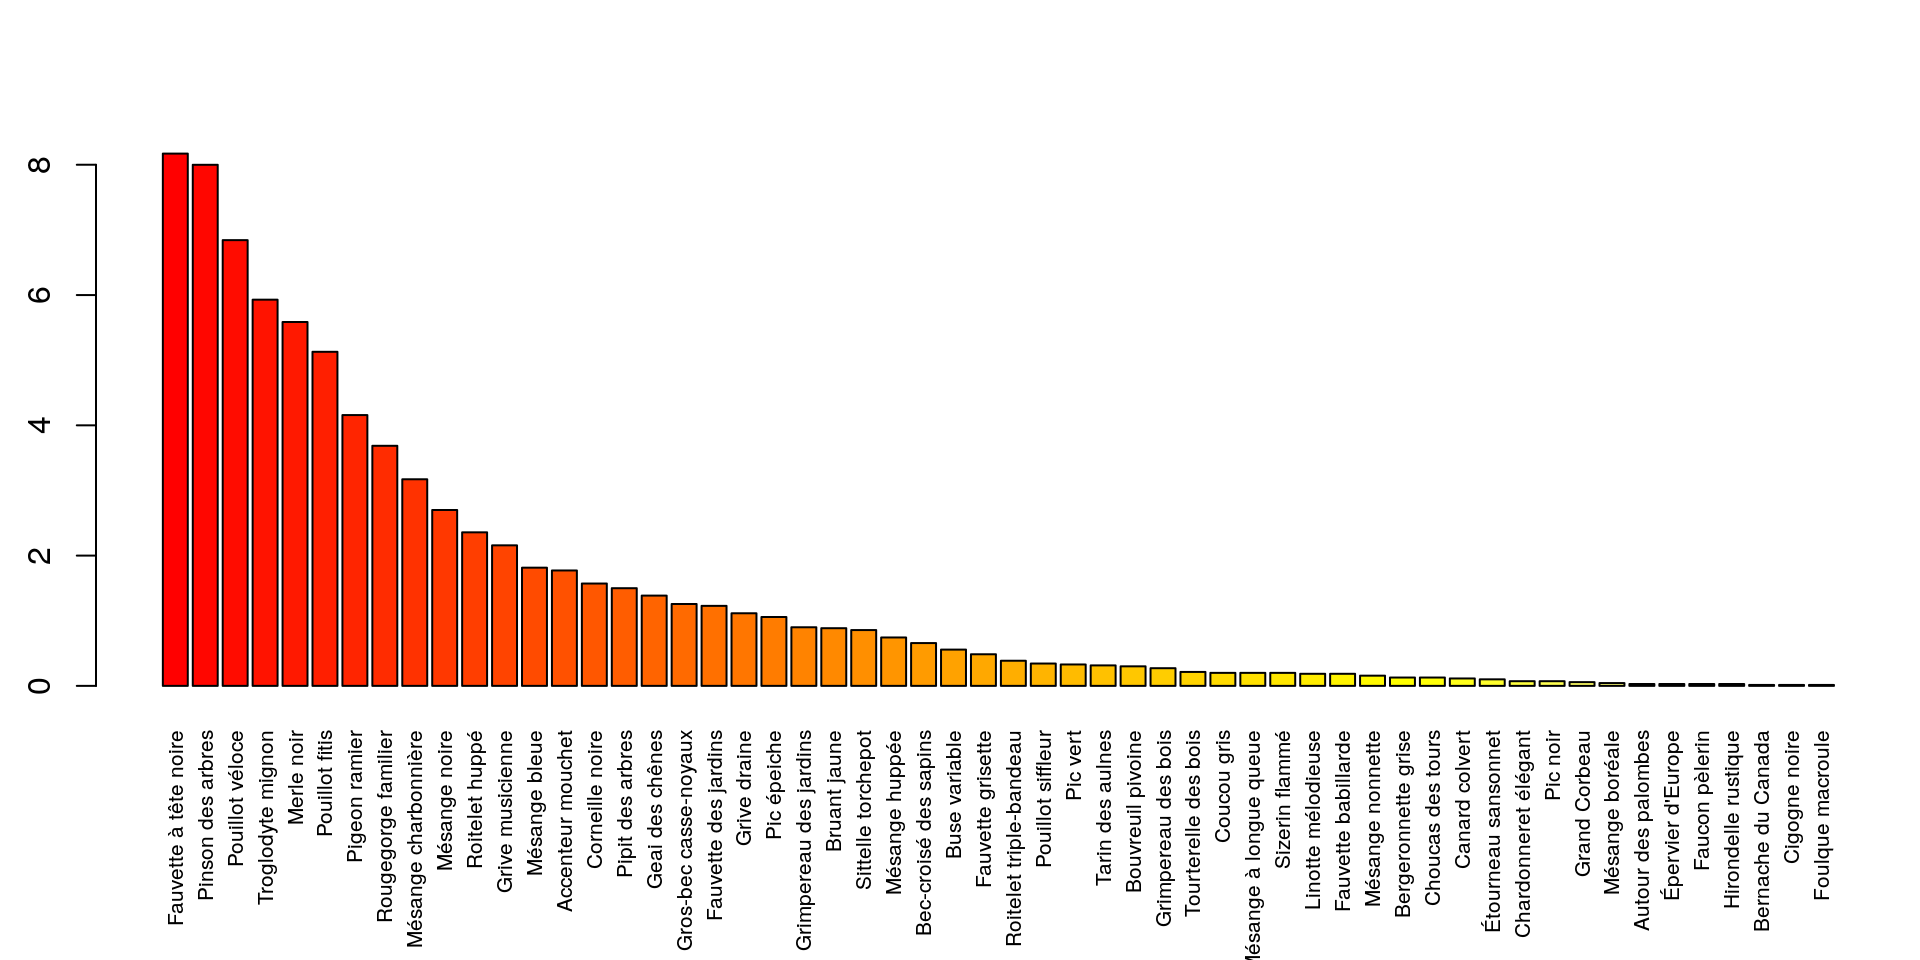
Bird density per point
During the surveys, 56 bird species were identified.
Butterflies (Rhopalocera)
During the drafting of the project, the aim was to target 15 zones to be inventoried each via 5 permanent inventory points. It quickly became clear to us that this goal had to be slightly revised downwards, for various reasons, foreseeable or not: * In order to minimize geographical redundancies, the points are placed about 500 m apart. LIFE sections of less than 2.5 km in length can therefore not contain the desired 5 points.
* The ease of traveling under certain lines has sometimes been undervalued, which significantly increases the time it takes to travel in a single area, up to a full day in the most extreme cases.
* The geographical spread of the sites on the Walloon Region imposes significant travel times between the sites, making it impossible for an observer to survey more than 2 sites on the same day.
The total number of butterfly inventory points sums up to 58, with 13 tested in 2012 but not repeated later since they were too inaccessible or time-consuming for the team to perform.
The remaining points and subsequently inventorized are localized in the following map. The data are later comprehensively presented as table with regard to the Walloon Region’s Red List.
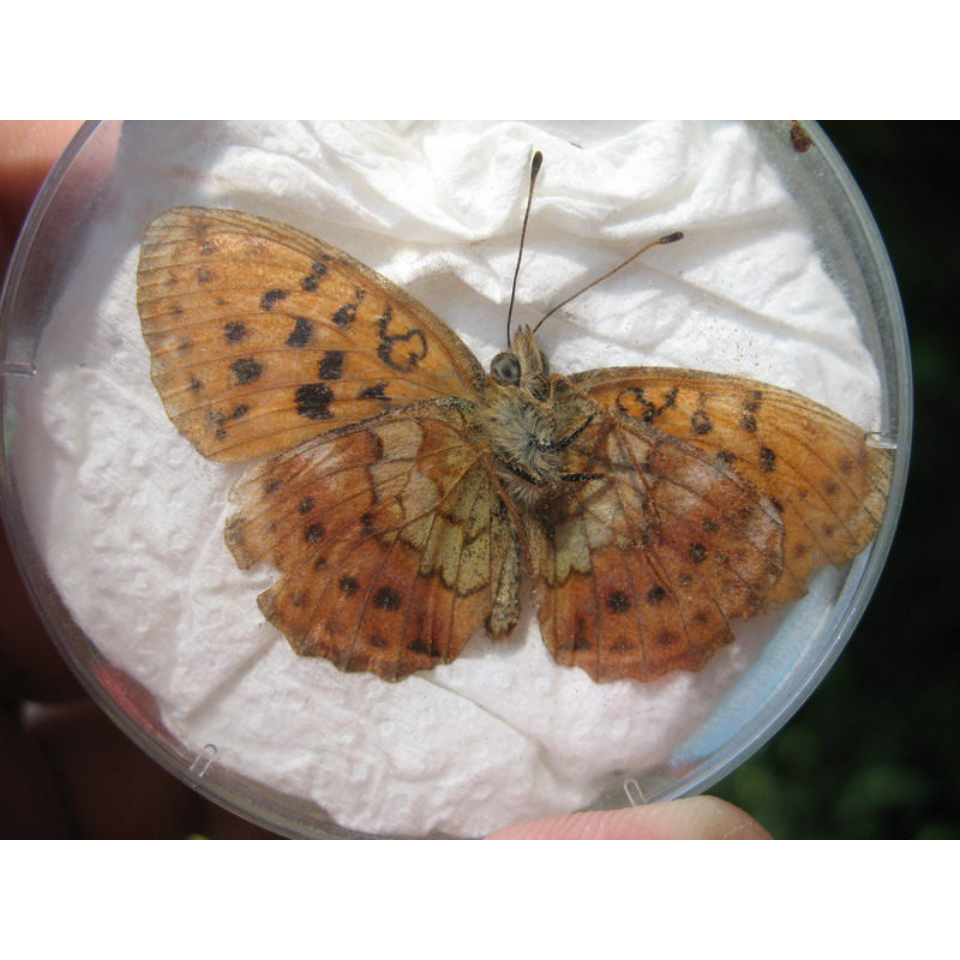
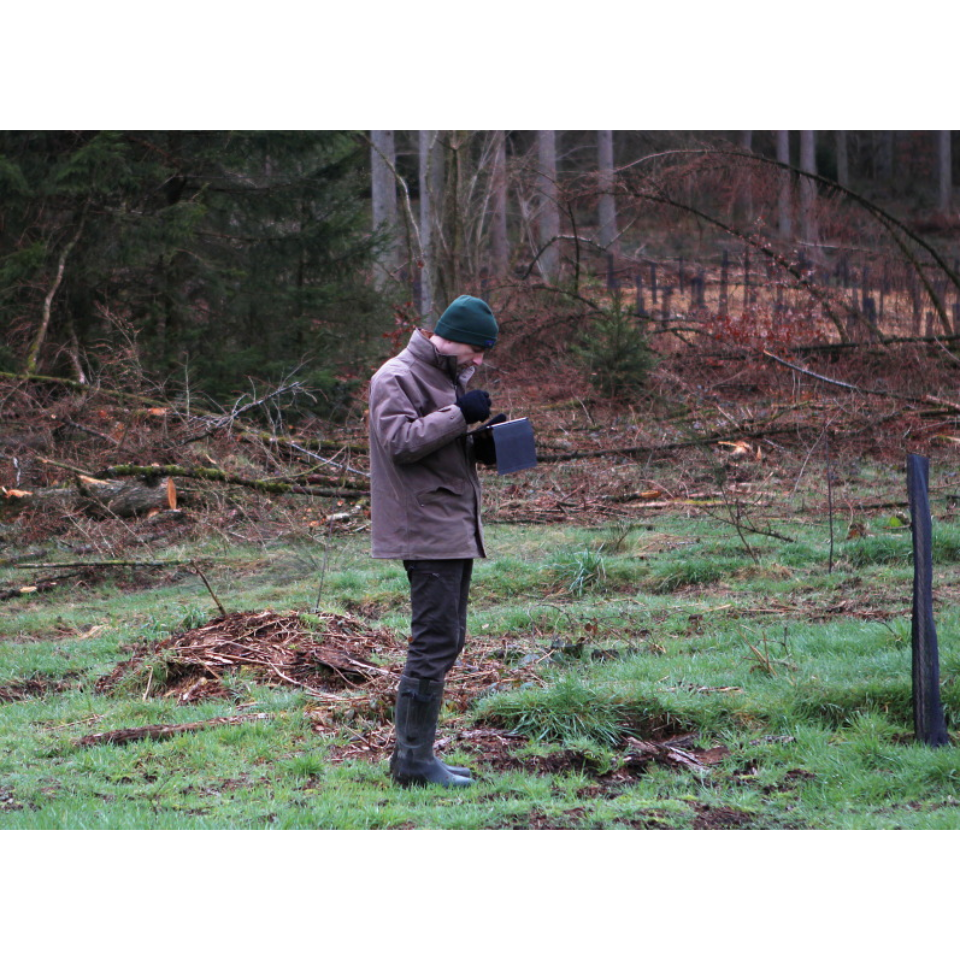
Handling a butterfly in the field for identification and for taking picture validating this data
Localization of standardized inventory points for butterflies
Click on the map or points to display the informationZoom in on points to discover their id’s
Sampling effort
| Inventory | |
|---|---|
| Anhée | 4 |
| Arlon | 5 |
| Bertrix-Neufchateau | 6 |
| Couvin | 3 |
| Doische | 2 |
| Durbuy | 3 |
| Florenville | 8 |
| Marche | 7 |
| Nassogne-Tennevile | 3 |
| Spa | 14 |
| Vielsalm | 1 |
| Year | Number of inventorization points | Number of data |
|---|---|---|
| 2011 | 0 | 0 |
| 2012 | 66 | 268 |
| 2013 | 0 | 0 |
| 2014 | 47 | 235 |
| 2015 | 49 | 225 |
| 2016 | 27 | 102 |
| 2017 | 34 | 199 |
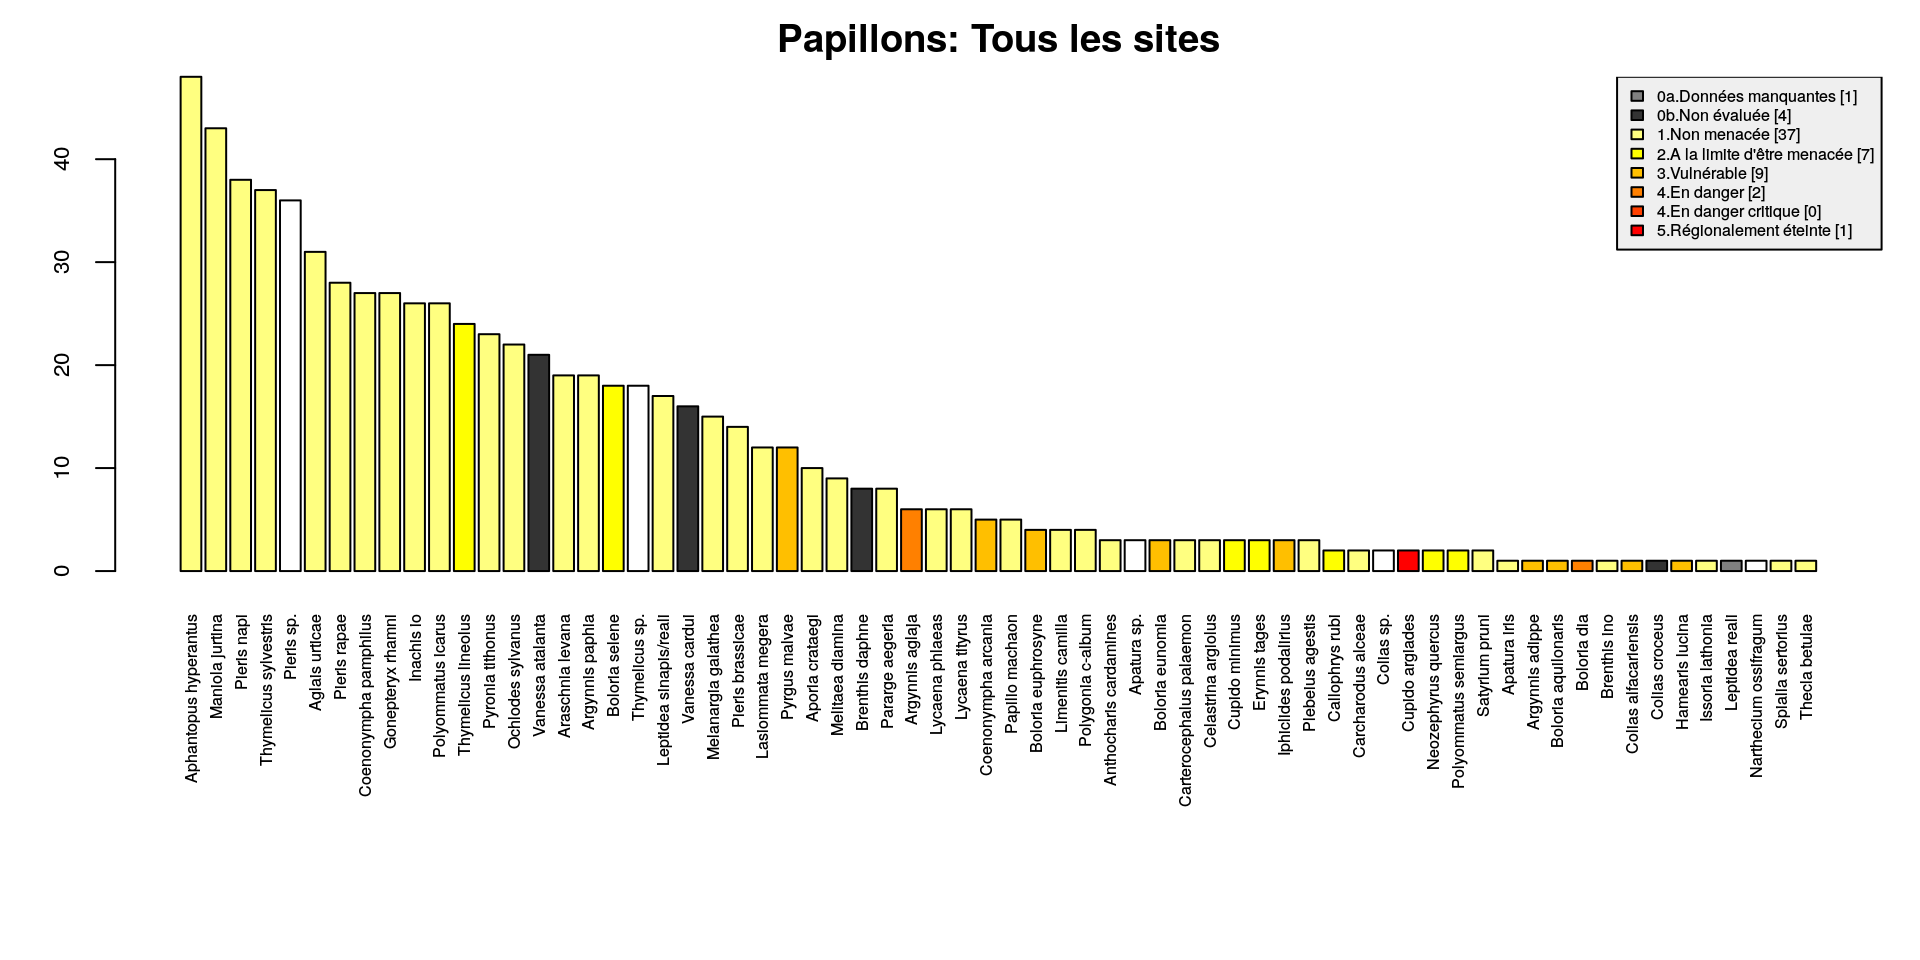
List of encountered species (standardized inventories)
Click on the column headings to sort the values, click on a line to mark it
Number of individuals per LIFE area. Name of LIFE areas: Zone 01: Couvin; Zone 02: Doische; Zone 04: Anhée; Zone 06: Marche-en-Famenne; Zone 07: Nassogne-Tenneville; Zone 09: Bertrix-Neufchâteau; Zone 10: Florenville; Zone 12: Durbuy; Zone 13: Spa; Zone 14: Vielsalm; Zone 15: Arlon
According to the classification of the red list of Walloon Region (Fichefet et al. 2008), the species are divided into categories according to the progression or the regression of their populations around a pivotal date. Some species are not evaluated if they were not present before the pivotal date (no possible comparison) or if they are migratory species carrying out cyclical invasions.
| Category | Number of species |
|---|---|
| 0a.Données manquantes | 1 |
| 0b.Non évaluée | 4 |
| 1.Non menacée | 37 |
| 2.A la limite d’être menacée | 7 |
| 3.Vulnérable | 9 |
| 4.En danger | 2 |
| 5.Régionalement éteinte | 1 |
Note: the category “5.Régionalement éteinte” refers to a species that has disappeared from Wallonia, that has recently been observed and is on the rise in the territory. Namely this species is Cupido argiades.
Number of species
| LIFE zone | Number of species |
|---|---|
| Zone 06: Marche-en-Famenne | 37 |
| Zone 01: Couvin | 36 |
| Zone 10: Florenville | 36 |
| Zone 13: Spa | 32 |
| Zone 07: Nassogne-Tenneville | 27 |
| Zone 15: Arlon | 27 |
| Zone 02: Doische | 26 |
| Zone 12: Durbuy | 26 |
| Zone 04: Anhée | 25 |
| Zone 09: Bertrix-Neufchâteau | 17 |
| Zone 14: Vielsalm | 15 |
Commonness of butterflies (as number of inventorised point with the presence of a species).
Dragonflies and damesflies (Odonata)
The objective of performing inventories on 20 ponds was quickly reached and will be outnumbered since 51 ponds were already visited to date. Although, it will be more pertinent to consider data as a whole for a group of close ponds, given the very high mobility of dragonflies. Inventories began when ponds were created for at least one year.
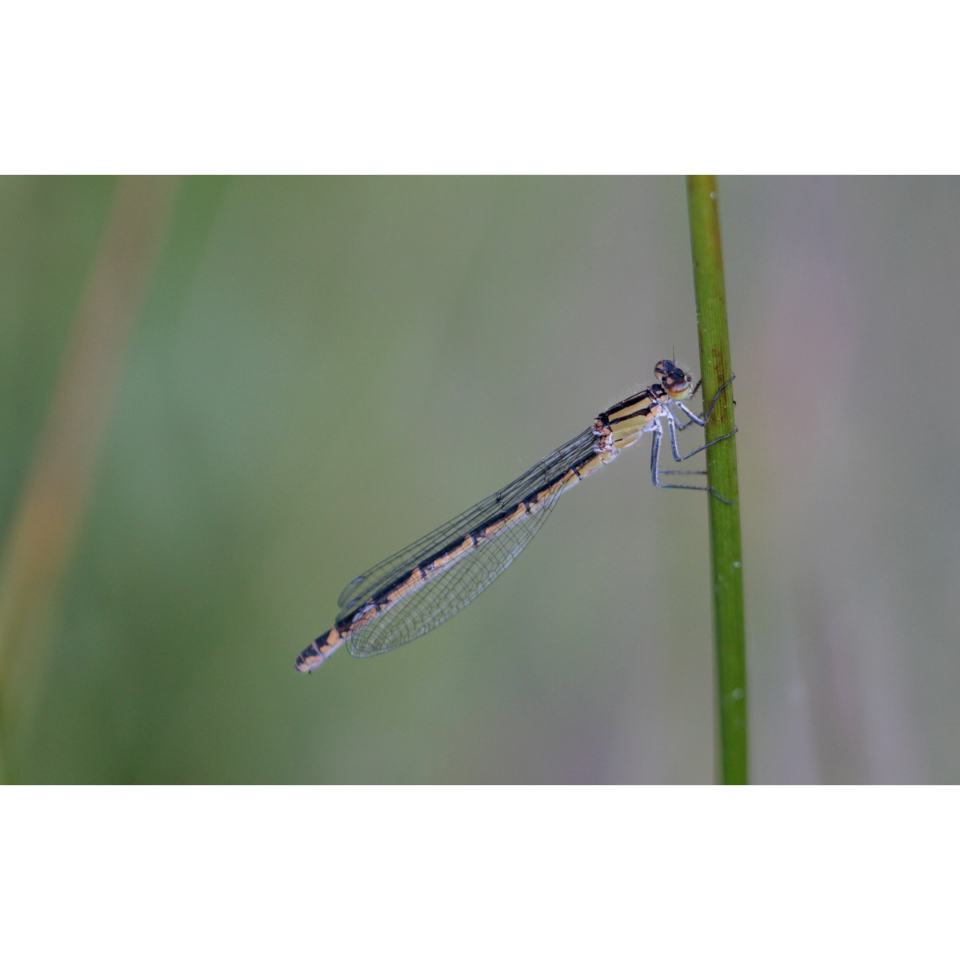
A damesfly (Enallagma cyathigerum)
Localization of standardized inventory points for Odonata
Click on the map or points to display the information
Sampling effort
| Inventory | |
|---|---|
| Beauraing | 5 |
| Doische | 15 |
| Marche | 5 |
| Nassogne-Tennevile | 17 |
| Spa | 2 |
| year | Number of inventorization points | Number of data |
|---|---|---|
| 2011 | 0 | 0 |
| 2012 | 0 | 0 |
| 2013 | 0 | 0 |
| 2014 | 0 | 0 |
| 2015 | 27 | 87 |
| 2016 | 26 | 94 |
| 2017 | 32 | 129 |
Results
Click on the column headings to sort the values, click on a line to mark it
List of species found in each LIFE zone. Name of LIFE zones: Zone 02: Doische; Zone 03: Beauraing; Zone 06: Marche-en-Famenne; Zone 07: Nassogne-Tenneville; Zone 13: Spa
Amphibians (Anura & Urodela)
The objective of carrying out inventories on 20 ponds was achieved in 2016. To date 29 ponds have been inventoried. Inventories began when ponds were created for at least one year and will were repeated in the third year of their natural evolution.
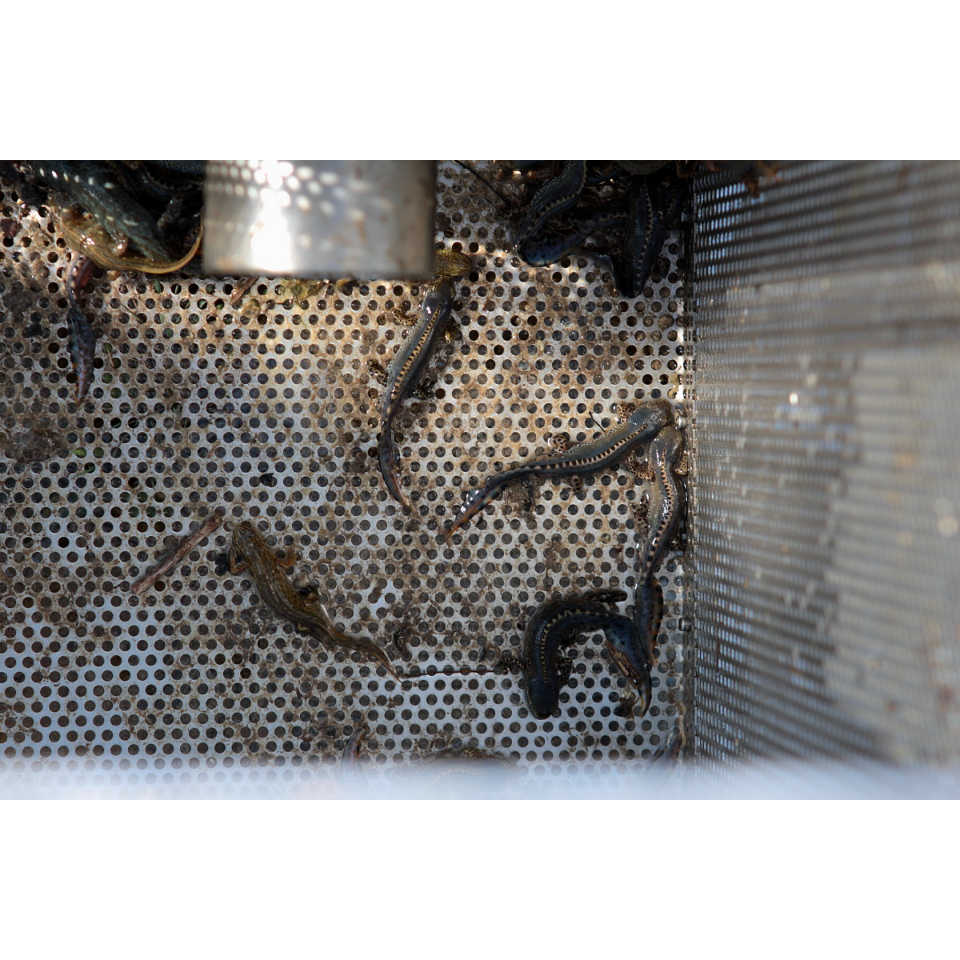
A few knewts at the bottom of one of the metal traps used for inventories
Method
For these inventories, we proceeded as follows:
* installing a semi-submerged metal trap and a floating trap in a pond in the early evening
* recovery of the device the following morning for identification and counting of imprisoned animals
* ventral photography of the crested newt if appropriate
* releasing of all individuals
* Disinfection (off-site) of equipment and rubber shoes by spraying a 2% solution of Halamid® disinfectant (p-toluenesulfonchloramide) to reduce the risk of spreading diseases potentially prensent in the water. Two pathogenic fungi may be present in the Walloon Region, namely Batrachochytrium dendrobatidis and Batrachochytrium salamandrivorans see also this article in “L’Echo des Rainettes”.
Localization of standardized inventory points for amphibians
Click on the map or points to display the information
Sampling effort
| Inventory | |
|---|---|
| Beauraing | 2 |
| Doische | 7 |
| Ferrières | 2 |
| Havelange | 2 |
| Marche | 2 |
| Nassogne-Tennevile | 5 |
| Spa | 9 |
| Year | Number of inventory per LIFE zone | Number of data |
|---|---|---|
| 2011 | 0 | 0 |
| 2012 | 0 | 0 |
| 2013 | 0 | 0 |
| 2014 | 0 | 0 |
| 2015 | 13 | 44 |
| 2016 | 14 | 22 |
| 2017 | 11 | 31 |
Results
| Z02 | Z03 | Z06 | Z07 | Z13 | Z23 | Z28 | |
|---|---|---|---|---|---|---|---|
| Rana temporaria | 0 | 1 | 2 | 2 | 0 | 0 | 1 |
| Triturus alpestris | 26 | 6 | 33 | 55 | 7 | 3 | 9 |
| Triturus helveticus | 39 | 8 | 46 | 45 | 9 | 8 | 6 |
| Triturus vulgaris | 0 | 0 | 7 | 0 | 0 | 0 | 0 |
Reptiles (Lizards, slowworm and snakes)
Reptiles are likely to occur in all habitats fitted out and managed by LIFE, among which are the edges (Action C1) and habitats of high biological value (Action C3) in particular. The forest edges well exposed to the sun, moors and peat bogs are habitats already too rarefied in the Walloon region and yet they are indispensable refuges to the populations of our three species of snakes.
These habitats associated with local features such as ponds and other water outfittings or the realization of hibernacula should be all the more favorable to snakes.
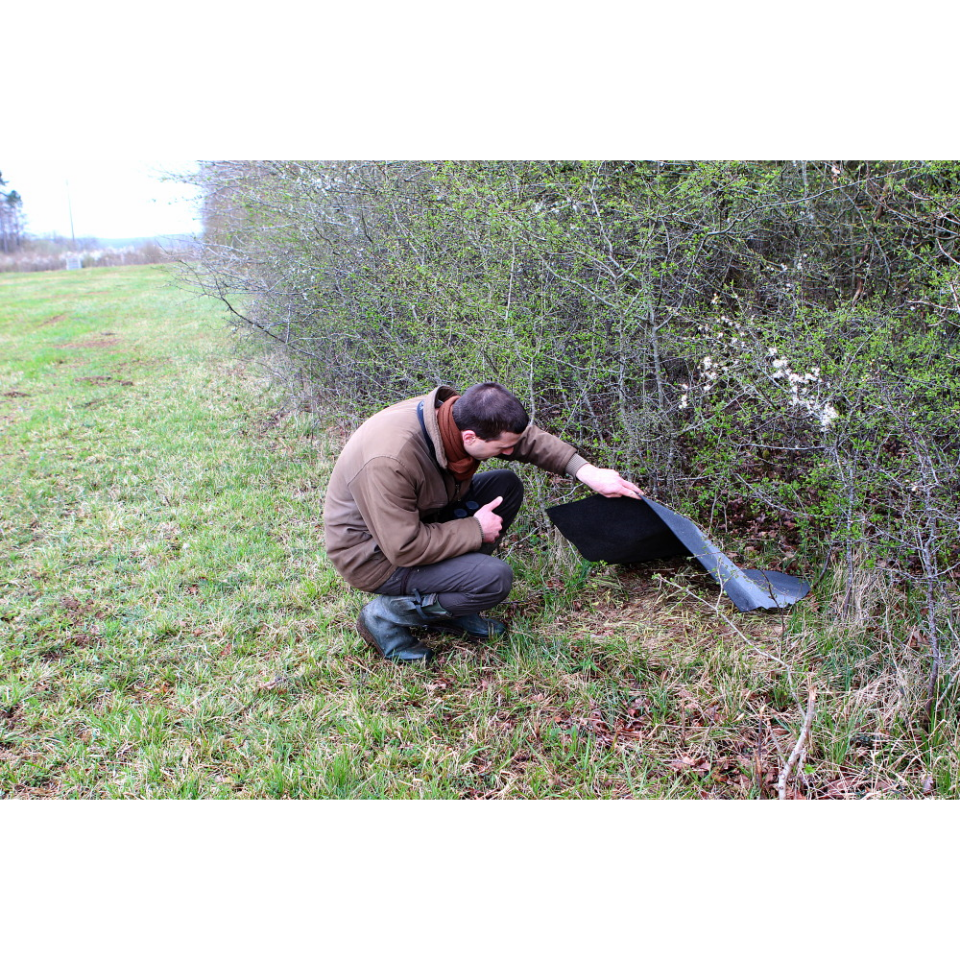
Counting of reptiles which shelter under the plates placed on the ground
Methodology
The most commonly used method for systematically identifying and counting reptiles is to arrange plates, steel or roofing sheets in suitable micro-habitats, and to verify regularly what is hidden there. We opted for pieces of roofing of 80 X 100 cm which were placed in 3 sites: Couvin (01), Beauraing (03) and Bertrix-Neufchâteau (09).
The sheets and the first inventories began in 2016.
Localization of standardized inventory points for reptiles
Click on the map or points to display the information
Sampling effort
| Inventory | |
|---|---|
| Beauraing | 9 |
| Bertrix-Neufchateau | 12 |
| Couvin | 12 |
| year | Number of inventory per LIFE zone | Number of data |
|---|---|---|
| 2011 | 0 | 0 |
| 2012 | 0 | 0 |
| 2013 | 0 | 0 |
| 2014 | 0 | 0 |
| 2015 | 0 | 0 |
| 2016 | 24 | 30 |
| 2017 | 10 | 15 |
Results
| 01 | 03 | |
|---|---|---|
| Anguis fragilis | 29 | 15 |
| Lacerta vivipara | 3 | 3 |
| Natrix natrix | 1 | 1 |
Higher plants
The main objective of the botanical description is to establish an inventory of the structure and plant composition in the forest corridors of the high voltage lines. Apart from the special cases of ponds and the removal of invasive plants, the effects of LIFE will be difficult to assess on a short time scale imposed by the duration of the LIFE Elia project.
We have opted for a transect description allowing the standardized description of habitat gradients from the herbaceous to tree strata. A transect is performed starting from the axis of the power line to the forest, in which a phytosociological inventory is carried out over a width of 5 m in each of the 3 elements present: herbaceous layer, shrubs and tree layer (including 5 first meters of the forest). A second transect is then made close to the opposite half of the corridor to account for the effect of exposure (see diagram below).
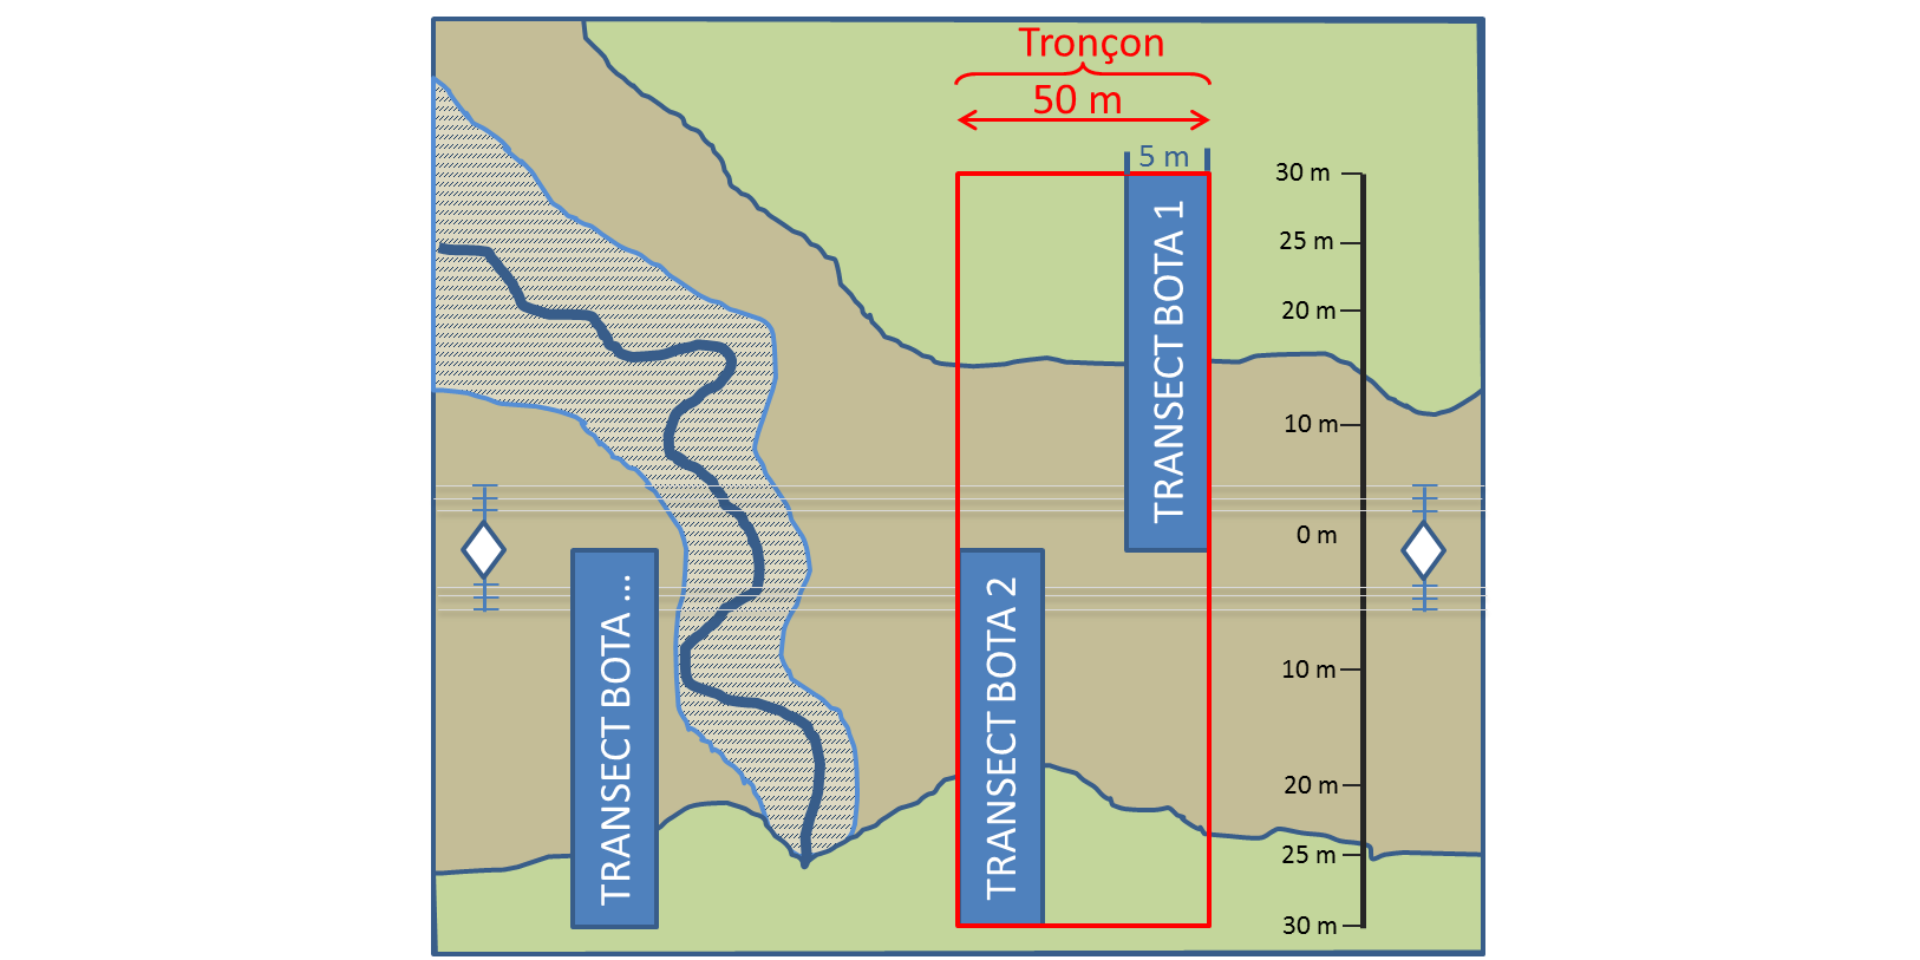
Arrangement of a pair of transects in a homogeneous zone of 50 m. Depending on the extent of the LIFE site, the observer continues to progress to a new representative habitat.
Localization of standardized inventory points for plants
The 20 transects currently carried out are distributed as follows in the natural regions of Wallonia:
| Natural region | No of transects |
|---|---|
| Ardenne | 10 |
| Condroz et sillon Sambro-Mosan | 10 |
Click on the map or points to display the information
Localization of standardized inventory transects for the botanical approach
Sampling effort
| Z04 | Z07 | Z09 | Z23 | Z26 | |
|---|---|---|---|---|---|
| 2011 | 0 | 0 | 0 | 0 | 0 |
| 2012 | 0 | 0 | 0 | 0 | 0 |
| 2013 | 0 | 0 | 0 | 0 | 0 |
| 2014 | 17 | 0 | 11 | 10 | 0 |
| 2015 | 0 | 7 | 0 | 0 | 4 |
| 2016 | 0 | 0 | 0 | 0 | 0 |
| 2017 | 0 | 0 | 0 | 0 | 0 |
Results
Comprehensive list of species observed at this stage (all inventories combined).
Click on the column headings to sort the values, click on a line to mark it
List of species found in each LIFE zone. Name of LIFE zones: Z26: LEGLISE; Z23: HAVELANGE; Z04: Anhée; Z07: NASSOGNE; Z04: Arbre; Z09: RECOGNE